Market Outlook
February 02, 2017
Market Cues
Domestic Indices
Chg (%)
(Pts)
(Close)
After witnessing sharp rally post budget Indian markets are likely to open flat with a
BSE Sensex
1.8
486
28,142
positive bias tracking SGX Nifty.
Nifty
1.8
155
8,716
US markets closed on a mixed note after not after seeing a initial strength during the
Mid Cap
1.8
228
13,085
day. While the Dow Jones remained flat, the NASADQ closed on strong note on the
Small Cap
1.7
217
13,153
back of strong results from tech stocks.
Bankex
2.8
615
22,927
The UK markets closed flat on mixed economic news. British manufacturing growth
remained strong at the start of the year with the Markit/CIPS purchasing managers'
Global Indices
Chg (%)
(Pts)
(Close)
index reported at 55.9 in January. However, U.K. house prices rose at a slower pace
in January than December and Shop prices in the United Kingdom were down 1.7
Dow Jones
0.1
27
19,891
percent YoY in January.
Nasdaq
0.5
28
5,643
FTSE
0.1
8
7,108
Indian markets rallied strongly on Wednesday as markets cheered the new Budget.
Nikkei
(0.4)
(84)
19,064
The budget did not carry any negative shocks and had some mild surprises that put
investors at ease. Most sectors rallied strongly with realty leading the market, after
Hang Seng
(0.4)
(84)
23,234
the Finance Minister announced that Affordable Housing would be given
Shanghai Com
0.3
10
3,159
infrastructure status. The only sector to underperform was pharma which closed
down on concerns that domestic prices could face price ceilings in the future.
Advances / Declines
BSE
NSE
News Analysis
Advances
1,929
1,177
Budget 2017-18 highlights
Declines
918
446
Maruti Suzuki sales January 2017
Unchanged
104
81
Detailed analysis on Pg2
Investor’s Ready Reckoner
Volumes (` Cr)
Key Domestic & Global Indicators
BSE
3,798
NSE
27,786
Stock Watch: Latest investment recommendations on 150+ stocks
Refer Pg7 onwards
Net Inflows (` Cr)
Net
Mtd
Ytd
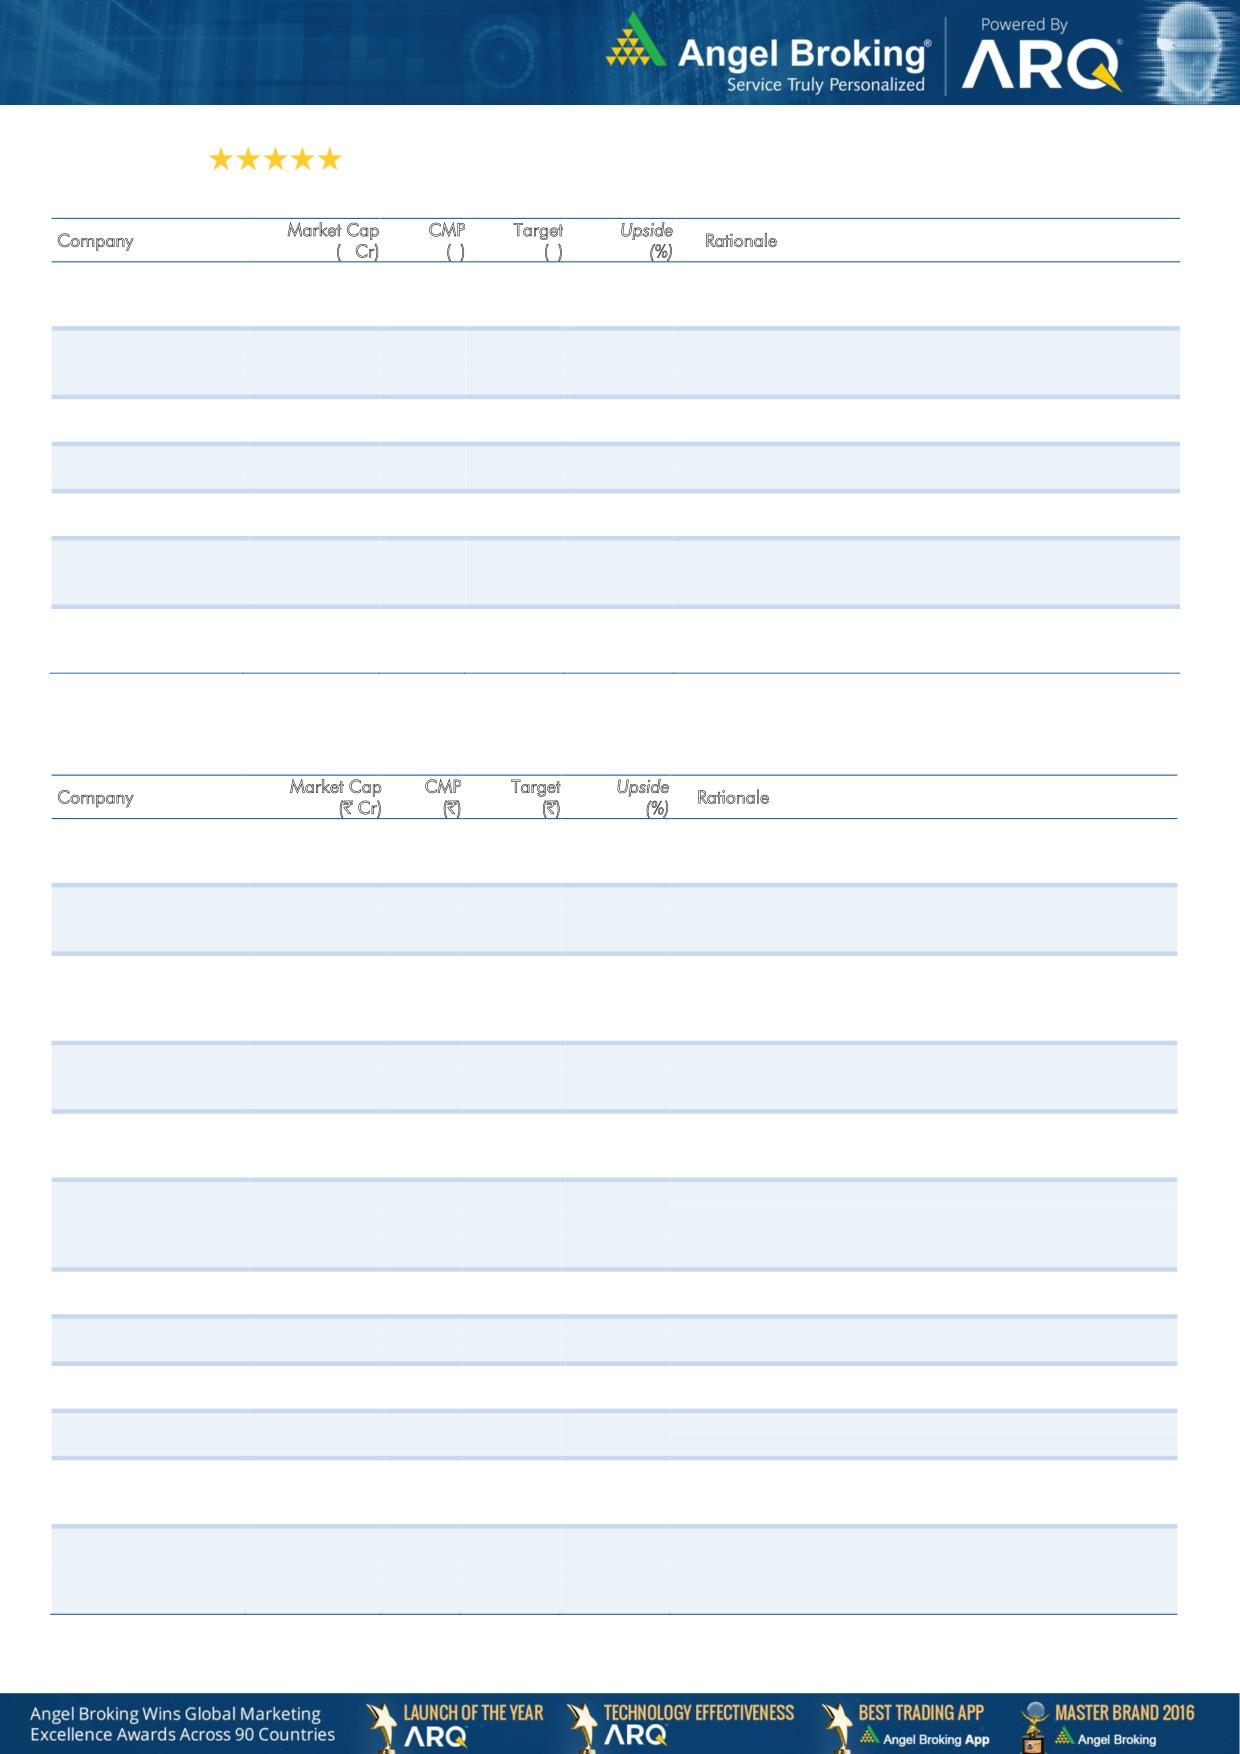
Top Picks
FII
451
(47)
(47)
CMP
Target
Upside
Company
Sector
Rating
(`)
(`)
(%)
MFs
(253)
5,215
5,215
Amara Raja Batteries Auto & Auto AncillaryAccumulate
900
1,009
12.1
Alkem Laboratories
Pharmaceuticals
Buy
1,695
1,989
17.4
Top Gainers
Price (`)
Chg (%)
HCL Tech
IT
Buy
814
1,000
22.8
Jpassociat
13
9.6
Power Grid Corp.
Power
Accumulate
206
223
8.4
Indiacem
159
9.4
Navkar Corp.
Others
Buy
171
265
55.3
More Top Picks on Pg5
Bharatfin
801
8.9
M&Mfin
286
7.3
Key Upcoming Events
Emamiltd
1,106
6.9
Previous
Consensus
Date
Region
Event Description
Reading
Expectations
Feb 02 China
PMI Manufacturing
51.3
51.2
Top Losers
Price (`)
Chg (%)
Feb 02 UK
BOE announces rates
0.3
0.3
Suzlon
16
(5.2)
Feb 02 US
Change in Nonfarm payrolls
156.0
175.0
Hathway
36
(2.9)
Feb 03 US
FOMC rate decision
0.8
0.8
Hexaware
189
(2.7)
Feb 03 Germany PMI Services
53.2
53.2
More Events on Pg6
Jetairways
392
(2.7)
Tcs
2,169
(2.7)
As on February 01, 2017
Market Outlook
February 02, 2017
News Analysis:
Budget 2017-18 highlights
The Budget 2017-18 met the investors’ expectations and rather delivered some
positive surprise in the form of 37% higher allocations on Housing. Infrastructure
as expected continued to get the required focus. While the Government’s ability to
retain its FY17 Fiscal Deficit target of 3.5% and indicating it to be 3.2% for FY18
was taken positively by the bond market as it indicates the Government will avoid
aggressive borrowing from the markets and hence interest rates will remain
benign for the quarter. On the back of demonetization there was fear of the
budget giving freebies and absence of that has proved that the Government is in
the right direction. One of the long standing issues had been the opaque nature of
funding to political parties and that has been addressed by reducing the limit of
cash receipts from per individuals to `2,000 from `20,000cr.
While there was no announcement for corporate tax rate cut, the FM has cut the
tax rate for SMEs with a turnover of up to `50cr to 25% from 30%. Further, the
budget FY18 leaves higher disposable income in the hands of individual’s in the
income category upto `5lakh, by reducing the income tax rate to 5% from existing
10%. Absence of news on tax on capital gain was accepted with a positive note by
the markets. Overall the budget has met the expectations of investors in general.
Maruti Suzuki sales January 2017
The country’s largest car market leader Maruti Suzuki after demonetization
notwithstanding has started the year on a robust note with sales growing 27.1% in
January to 1.44lakh units as against 1.13lakh units clocked in the same month last
year. Domestic sales marked a growth of 25.9% to 1.33lakh units led by Baleno
and Brezza which continued to attract buyers even months after their launch were
as the sales in the corresponding month last year stood at 1.06lakh units. Sales of
utility vehicles including Ertiga and Brezza doubled to 16,313 units during the
month. Sales of its only executive sedan Ciaz grew by 20% to 6,530 units. With the
exception of the super compact segment where Maruti sells the Dzire Tour sedan,
which fell by 15%, all other segments have marked growth. Segment with aging
models like Alto and WagonR too marked a growth of 11% during the month.
Even exports grew robustly to 10,462 units, a rise of nearly 45% compared to
7,223 units sold in the same month last year. We have a BUY rating on the stock.
Economic and Political News
Manufacturing PMI rises to 50.4 in January from 49.6 in December
Govt. allocates `3.96 lakh cr. for infrastructure spending
Affordable housing given infrastructure status
Corporate News
Ashok Leyland sales up by 8% YoY in January 2017
Indian Oil Corp hikes the price of aviation turbine fuel (ATF) or jet fuel price
by 2.9%
Market Outlook
February 02, 2017
Quarterly Bloomberg Brokers Consensus Estimate
Glenmark Pharmaceuticals Ltd Consol - Feb 2, 2017
Particulars ( ` cr)
3QFY17E
3QFY16
y-o-y (%)
2QFY17
q-o-q (%)
Net sales
2,186
1,764
23.9
2,173
0.6
EBITDA
443
370
19.8
449
(1.3)
EBITDA margin (%)
20.3
21.0
20.6
Net profit
258
170
51.9
224
15.5
Marico Ltd - Feb 2, 2017
Particulars ( ` cr)
3QFY17E
3QFY16
y-o-y (%)
2QFY17
q-o-q (%)
Net sales
1457
1556
(6.4)
1443
1.0
EBITDA
273
294
(7.1)
253
7.9
EBITDA margin (%)
18.7
18.9
17.5
Net profit
194
198
(2.0)
181
7.2
ACC Ltd - Feb 3, 2017
Particulars ( ` cr)
4QCY16E
4QCY15
y-o-y (%)
3QCY16
q-o-q (%)
Net sales
2,654
2,846
(6.8)
2,471
7.4
EBITDA
343
282
21.7
273
25.4
EBITDA margin (%)
12.9
9.9
11.1
Net profit
167
103
62.4
84
98.0
Divi's Laboratories Ltd - Feb 4, 2017
Particulars ( ` cr)
3QFY17E
3QFY16
y-o-y (%)
2QFY17
q-o-q (%)
Net sales
1,123
852
31.8
1,003
12.0
EBITDA
378
322
17.4
291
30.0
EBITDA margin (%)
33.7
37.8
29.0
Net profit
299
247
21.3
224
33.7
Dr Reddy's Laboratories Ltd Consol - Feb 4, 2017
Particulars ( ` cr)
3QFY17E
3QFY16
y-o-y (%)
2QFY17
q-o-q (%)
Net sales
3,542
3,968
(10.7)
3,586
(1.2)
EBITDA
645
1,016
(36.5)
623
3.5
EBITDA margin (%)
18.2
25.6
17.4
Net profit
331
579
(42.9)
474
(30.2)
Market Outlook
February 02, 2017
Top Picks
Large Cap
M
arket Cap
CM
P
T
arget
Upsid
e
Company
Rationale
(` Cr)
(`)
(`)
(%)
To outpace battery industry growth due to better
Amara Raja Batteries
15,368
900
1,009
12.1
technological products leading to market share gains in both
the automotive OEM and replacement segments.
Strong growth in domestic business due to its leadership in
Alkem Laboratories
20,263
1,695
1,989
17.4
acute therapeutic segment. Alkem expects to launch more
products in USA, which bodes for its international business.
The stock is trading at attractive valuations and is factoring
HCL Tech
1,14,907
814
1,000
22.8
all the bad news.
Back on the growth trend, expect a long term growth of 14%
Infosys
2,10,526
917
1,249
36.2
to be a US$20bn in FY2020.
Strong order backlog and improvement in execution would
Larsen & Toubro
1,39,039
1,491
1,634
9.6
trigger the growth for the L&T
One of the largest pharma companies with strong
Lupin
66,454
1,472
1,809
22.9
international presence. It has a rich pipeline of ANDAs which
is also one of the largest among the generic companies.
Going forward, we expect the company to report strong top-
Power Grid Corporation
1,07,666
206
223
8.4
line CAGR of ~16% and bottom-line CAGR of ~19% over
FY16-18 on back of strong capitalization guidance
Source: Company, Angel Research
Mid Cap
M
arket Cap
CM
P
T
arget
Upsid
e
Company
Rationale
(` Cr)
(`)
(`)
(%)
We expect the company would report strong profitability
Asian Granito
820
273
351
28.8
owing to better product mix, higher B2C sales and
amalgamation synergy.
Among the top 4 players in the consumer durables segment.
Bajaj Electricals
2,457
243
274
12.8
Improved profitability backed by turn around in E&P segment.
Strong order book lends earnings visibility.
Favourable outlook for the AC industry to augur well for
Cooling products business which is out pacing the market
Blue Star
5,067
530
634
19.5
growth. EMPPAC division's profitability to improve once
operating environment turns around.
With a focus on the low and medium income (LMI) consumer
Dewan Housing Finance
9,250
295
350
18.5
segment, the company has increased its presence in tier-II &
III cities where the growth opportunity is immense.
Strong loan growth backed by diversified loan portfolio and
Equitas Holdings
5,718
171
235
37.8
adequate CAR. ROE & ROA likely to remain decent as risk of
dilution remains low. Attractive valuations considering growth.
Economic recovery to have favourable impact on advertising
& circulation revenue growth. Further, the acquisition of a
Jagran Prakashan
6,058
185
225
21.4
radio business (Radio City) would also boost the company's
revenue growth.
High order book execution in EPC segment, rising B2C sales
KEI Industries
1,089
140
153
9.3
and higher exports to boost the revenues and profitability
Speedier execution and speedier sales, strong revenue visibilty
Mahindra Lifespace
1,461
356
522
46.6
in short-to-long run, attractive valuations
Higher growth in domestic branded sales and healthy export
Mirza International
1,100
91
107
17.0
to boost the profitability.
Massive capacity expansion along with rail advantage at ICD
Navkar Corporation
2,433
171
265
55.3
as well CFS augurs well for the company
Strong brands and distribution network would boost growth
Siyaram Silk Mills
1,340
1,430
1,605
12.3
going ahead. Stock currently trades at an inexpensive
valuation.
Market leadership in Hindi news genre and no. 2 viewership
ranking in English news genre, exit from the radio business,
TV Today Network
1,609
270
385
42.7
and anticipated growth in ad spends by corporates to benefit
the stock.
Source: Company, Angel Research
Market Outlook
February 02, 2017
Key Upcoming Events
Result Calendar
Date
Company
Feb 2, 2017
Vijaya Bank, Marico, HSIL, Glenmark Pharma., Transport Corporation of India, UFO Moviez, Team Lease Serv.
Feb 3, 2017
ACC, J K Lakshmi Cements, PVR, MRF, Quick Heal, Manpasand Bever.
Feb 4, 2017
J & K Bank, Oriental Bank, Central Bank, Relaxo, Dr Reddy's, Divi's Lab.
Feb 6, 2017
Automotive Axle, LMW, GSPL, Abbott India, Banco
CEAT, BHEL, Ramco Cements, Punjab Natl.Bank, IDBI Bank, United Bank, Hexaware, Tata Steel, Godawari Ispat, L G
Feb 7, 2017
Balakrishnan & Bros, NHPC
Tata Chemicals, Hero Motocorp, Bharat Forge, Siemens, Thermax, Union Bank, Indraprasth Gas, Elecon Engineering,
Feb 8, 2017
Cipla, NTPC, Competent Automobiles, Coffee Day Enterprises Ltd
Source: Bloomberg, Angel Research
Global economic events release calendar
Date
Time
Country
Event Description
Unit
Period
Bloomberg Data
Last Reported Estimated
Feb 2, 2017
6:30AM
China
PMI Manufacturing
Value
Jan
51.30
51.20
5:30PM
UK
BOE Announces rates
% Ratio
Feb 2
0.25
0.25
7:00PM
US
Change in Nonfarm payrolls
Thousands
Jan
156.00
175.00
Feb 3, 2017
12:30AM
US
FOMC rate decision
%
Feb 1
0.75
0.75
2:25PM
Germany
PMI Services
Value
Jan F
53.20
53.20
7:00PM
US
Unnemployment rate
%
Jan
4.70
4.70
Feb 8, 2017
2:30PM
India
RBI Reverse Repo rate
%
Feb 8
5.75
--
2:30PM
India
RBI Repo rate
%
Feb 8
6.25
--
2:30PM
India
RBI Cash Reserve ratio
%
Feb 8
4.00
--
Feb 10, 2017
India
Imports YoY%
% Change
Jan
0.50
--
India
Exports YoY%
% Change
Jan
5.70
--
China
Exports YoY%
% Change
Jan
(6.20)
2.80
3:00PM
UK
Industrial Production (YoY)
% Change
Dec
2.00
--
5:30PM
India
Industrial Production YoY
% Change
Dec
5.70
--
Feb 14, 2017
3:00PM
UK
CPI (YoY)
% Change
Jan
1.60
--
3:30PM
Euro Zone
Euro-Zone GDP s.a. (QoQ)
% Change
4Q P
0.50
--
12:00PM
India
Monthly Wholesale Prices YoY%
% Change
Jan
3.39
--
US
Producer Price Index (mom)
% Change
Jan
0.80
--
7:00AM
China
Consumer Price Index (YoY)
% Change
Jan
2.10
2.30
12:30PM
Germany
GDP nsa (YoY)
% Change
4Q P
1.50
--
Feb 15, 2017
7:00PM
US
Consumer price index (mom)
% Change
Jan
0.30
0.30
3:00PM
UK
Jobless claims change
% Change
Jan
(10.10)
--
7:45PM
US
Industrial Production
%
Jan
0.83
--
Feb 16, 2017
7:00PM
US
Housing Starts
Thousands
Jan
1,226.00
1,226.00
8:30PM
Euro Zone
Euro-Zone Consumer Confidence
Value
Feb A
(4.90)
--
Feb 20, 2017
3:00PM
UK
GDP (YoY)
% Change
4Q P
2.20
--
Feb 22, 2017
8:30PM
US
Existing home sales
Million
Jan
5.49
--
7:00PM
US
Building permits
Thousands
Jan
1,228.00
1,235.00
3:30PM
Euro Zone
Euro-Zone CPI (YoY)
%
Jan F
1.80
--
Source: Bloomberg, Angel Research
Market Outlook
February 02, 2017
Macro watch
Exhibit 1: Quarterly GDP trends
Exhibit 2: IIP trends
(%)
(%)
9.0
8.3
7.0
5.7
7.9
6.0
8.0
7.5
7.5
7.6
7.3
5.0
7.2
7.1
6.6
6.7
4.0
7.0
6.4
3.0
2.2
5.8
1.9
6.0
2.0
1.3
0.7
1.0
0.3
5.0
-
4.0
(1.0)
(0.7)
(2.0)
(1.3)
3.0
(1.6)
(1.8)
(3.0)
(2.5)
Source: CSO, Angel Research
Source: MOSPI, Angel Research
Exhibit 3: Monthly CPI inflation trends
Exhibit 4: Manufacturing and services PMI
56.0
Mfg. PMI
Services PMI
(%)
7.0
54.0
6.1
5.7
5.8
5.8
6.0
5.3
5.5
5.1
52.0
4.8
5.0
4.4
4.2
50.0
4.0
3.6
3.4
48.0
3.0
46.0
2.0
1.0
44.0
-
42.0
Source: MOSPI, Angel Research
Source: Market, Angel Research; Note: Level above 50 indicates expansion
Exhibit 5: Exports and imports growth trends
Exhibit 6: Key policy rates
(%)
Exports yoy growth
Imports yoy growth
(%)
Repo rate
Reverse Repo rate
CRR
15.0
7.00
10.0
6.50
5.0
6.00
0.0
5.50
(5.0)
5.00
(10.0)
4.50
(15.0)
(20.0)
4.00
(25.0)
3.50
(30.0)
3.00
Source: Bloomberg, Angel Research
Source: RBI, Angel Research
Market Outlook
February 02, 2017
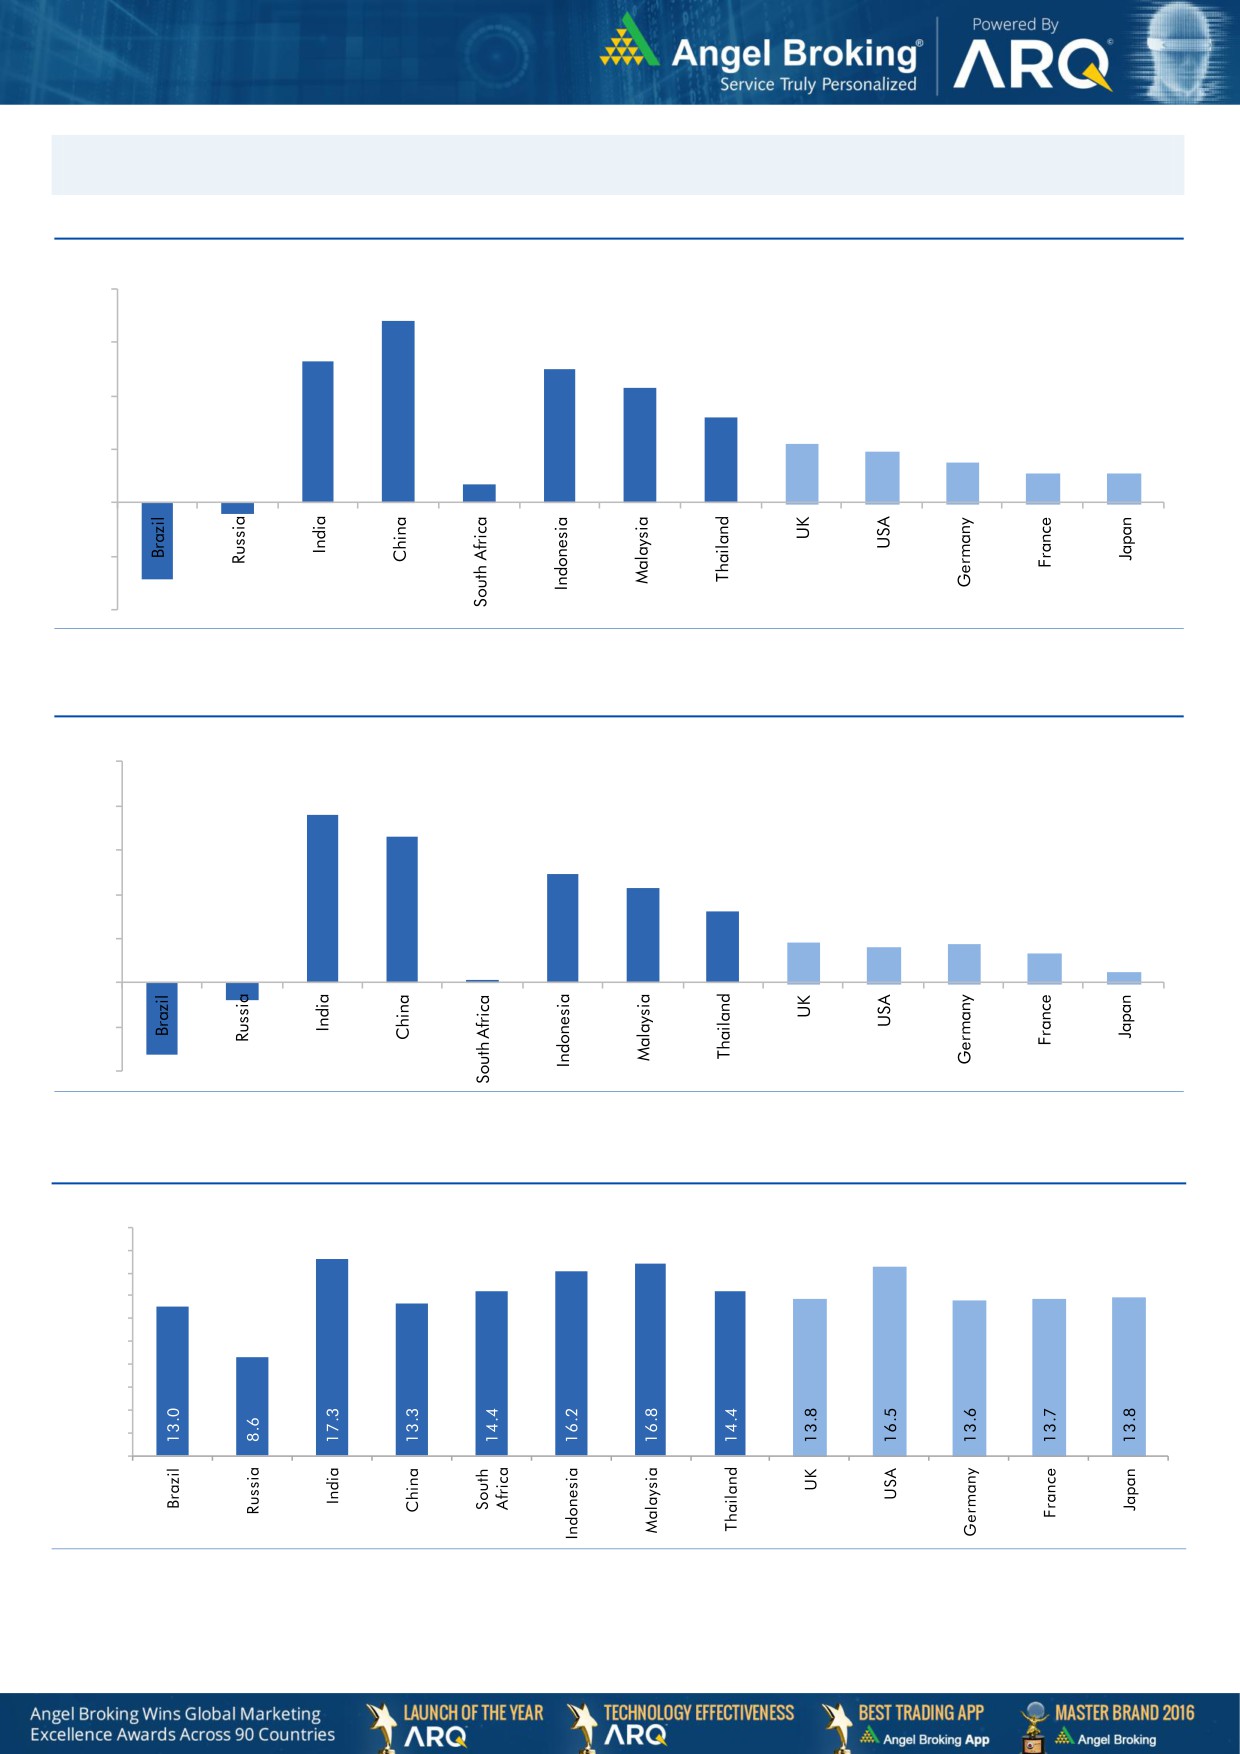
Global watch
Exhibit 1: Latest quarterly GDP Growth (%, yoy) across select developing and developed countries
(%)
8.0
6.8
5.3
6.0
5.0
0.7
4.3
4.0
3.2
2.2
1.9
1.5
2.0
1.1
1.1
-
(2.0)
(0.4)
(2.9)
(4.0)
Source: Bloomberg, Angel Research
Exhibit 2: 2016 GDP Growth projection by IMF (%, yoy) across select developing and developed countries
(%)
10.0
7.6
8.0
6.6
6.0
4.9
4.3
4.0
3.2
1.8
1.6
1.7
2.0
1.3
(0.8)
0.5
(3.3)
0.1
-
(2.0)
(4.0)
Source: IMF, Angel Research
Exhibit 3: One year forward P-E ratio across select developing and developed countries
(x)
20.0
18.0
16.0
14.0
12.0
10.0
8.0
6.0
4.0
2.0
-
Source: IMF, Angel Research
Market Outlook
February 02, 2017
Exhibit 4: Relative performance of indices across globe
Returns (%)
Country
Name of index
Closing price
1M
3M
1YR
Brazil
Bovespa
64,836
7.7
0.8
59.8
Russia
Micex
2,232
(0.0)
11.8
24.8
India
Nifty
8,716
6.5
1.0
17.2
China
Shanghai Composite
3,159
1.2
1.5
8.4
South Africa
Top 40
46,213
5.3
4.3
4.9
Mexico
Mexbol
47,010
2.9
(2.1)
8.7
Indonesia
LQ45
886
0.7
(3.9)
12.0
Malaysia
KLCI
1,686
4.1
0.7
5.3
Thailand
SET 50
985
2.4
4.9
27.0
USA
Dow Jones
19,891
0.4
9.5
21.8
UK
FTSE
7,108
1.6
3.3
18.6
Japan
Nikkei
19,148
0.2
13.3
14.2
Germany
DAX
11,660
0.5
12.4
31.3
France
CAC
4,795
(1.8)
8.6
23.0
Source: Bloomberg, Angel Research
Stock Watch
February 02, 2017
Company Name
Reco
CMP
Target
Mkt Cap
Sales ( Čcr )
OPM(%)
EPS (Č)
PER(x)
P/BV(x)
RoE(%)
EV/Sales(x)
(Č)
Price ( Č)
( Č cr )
FY17E FY18E
FY17E
FY18E
FY17E
FY18E
FY17E
FY18E
FY17E
FY18E
FY17E
FY18E
FY17E
FY18E
Agri / Agri Chemical
Rallis
Neutral
239
-
4,647
1,937
2,164
13.3
14.3
9.0
11.0
26.6
21.7
4.6
4.0
18.4
19.8
2.4
2.1
United Phosphorus
Neutral
740
-
37,492
15,176
17,604
18.5
18.5
37.4
44.6
19.8
16.6
3.9
3.2
21.4
21.2
2.6
2.2
Auto & Auto Ancillary
Ashok Leyland
Buy
92
111
26,225
22,407
26,022
10.6
10.6
5.2
6.4
17.7
14.4
4.0
3.4
23.6
24.7
1.3
1.1
Bajaj Auto
Neutral
2,857
-
82,662
25,093
27,891
19.5
19.2
143.9
162.5
19.9
17.6
5.6
4.8
30.3
29.4
3.0
2.6
Bharat Forge
Neutral
970
-
22,582
7,726
8,713
20.5
21.2
35.3
42.7
27.5
22.7
5.1
4.6
18.9
20.1
3.0
2.6
Eicher Motors
Neutral
24,030
-
65,369
16,583
20,447
17.5
18.0
598.0
745.2
40.2
32.3
13.7
10.5
41.2
38.3
3.8
3.0
Gabriel India
Buy
111
130
1,595
1,544
1,715
9.0
9.3
5.4
6.3
20.6
17.6
3.9
3.4
18.9
19.5
1.0
0.9
Hero Motocorp
Accumulate
3,284
3,541
65,581
30,958
34,139
15.7
15.7
193.6
208.3
17.0
15.8
6.6
5.5
34.2
30.5
2.0
1.8
Jamna Auto Industries Neutral
189
-
1,502
1,486
1,620
9.8
9.9
15.0
17.2
12.6
11.0
2.8
2.3
21.8
21.3
1.1
1.0
L G Balakrishnan & Bros Neutral
578
-
907
1,302
1,432
11.6
11.9
43.7
53.0
13.2
10.9
1.9
1.7
13.8
14.2
0.8
0.7
Mahindra and Mahindra Neutral
1,297
-
80,549
46,534
53,077
11.6
11.7
67.3
78.1
19.3
16.6
3.1
2.7
15.4
15.8
1.7
1.5
Maruti
Accumulate
6,173
6,560
186,470
67,822
83,288
16.0
16.4
253.8
312.4
24.3
19.8
5.6
4.5
23.0
22.9
2.4
1.9
Minda Industries
Neutral
357
-
2,832
2,728
3,042
9.0
9.1
68.2
86.2
5.2
4.1
1.2
0.9
23.8
24.3
1.1
0.9
Motherson Sumi
Neutral
337
-
47,337
45,896
53,687
7.8
8.3
13.0
16.1
25.9
21.0
8.3
6.7
34.7
35.4
1.1
0.9
Rane Brake Lining
Neutral
976
-
773
511
562
11.3
11.5
28.1
30.9
34.8
31.6
5.3
4.8
15.3
15.0
1.7
1.5
Setco Automotive
Neutral
37
-
499
741
837
13.0
13.0
15.2
17.0
2.5
2.2
0.4
0.4
15.8
16.3
1.1
1.0
Tata Motors
Neutral
542
-
156,400
300,209
338,549
8.9
8.4
42.7
54.3
12.7
10.0
2.0
1.7
15.6
17.2
0.6
0.6
TVS Motor
Neutral
394
-
18,723
13,390
15,948
6.9
7.1
12.8
16.5
30.9
23.8
7.7
6.1
26.3
27.2
1.4
1.2
Amara Raja Batteries
Accumulate
900
1,009
15,368
5,305
6,100
16.0
16.3
28.4
34.0
31.7
26.5
6.1
5.1
19.3
19.3
2.9
2.5
Exide Industries
Neutral
203
-
17,251
7,439
8,307
15.0
15.0
8.1
9.3
25.1
21.8
3.5
3.1
14.3
16.7
1.9
1.7
Apollo Tyres
Buy
187
235
9,519
12,877
14,504
14.3
13.9
21.4
23.0
8.7
8.1
1.4
1.2
16.4
15.2
0.9
0.8
Ceat
Buy
1,208
1,450
4,885
7,524
8,624
13.0
12.7
131.1
144.3
9.2
8.4
1.7
1.4
19.8
18.6
0.7
0.6
JK Tyres
Neutral
123
-
2,784
7,455
8,056
15.0
15.0
21.8
24.5
5.6
5.0
1.2
1.0
22.8
21.3
0.5
0.4
Swaraj Engines
Neutral
1,420
-
1,764
660
810
15.2
16.4
54.5
72.8
26.1
19.5
8.1
7.4
31.5
39.2
2.5
2.0
Subros
Neutral
182
-
1,094
1,488
1,681
11.7
11.9
6.4
7.2
28.5
25.5
3.0
2.7
10.8
11.4
1.0
0.8
Indag Rubber
Neutral
182
-
476
286
326
19.8
16.8
11.7
13.3
15.5
13.6
2.6
2.5
17.8
17.1
1.3
1.2
Capital Goods
ACE
Neutral
49
-
481
709
814
4.1
4.6
1.4
2.1
34.7
23.1
1.4
1.4
4.4
6.0
0.8
0.7
BEML
Neutral
1,243
-
5,175
3,451
4,055
6.3
9.2
31.4
57.9
39.6
21.5
2.4
2.2
6.3
10.9
1.6
1.4
Bharat Electronics
Neutral
1,568
-
35,032
8,137
9,169
16.8
17.2
58.7
62.5
26.7
25.1
4.1
3.7
44.6
46.3
3.3
2.9
Stock Watch
February 02, 2017
Company Name
Reco
CMP
Target
Mkt Cap
Sales ( Čcr )
OPM(%)
EPS (Č)
PER(x)
P/BV(x)
RoE(%)
EV/Sales(x)
(Č)
Price ( Č)
( Č cr )
FY17E
FY18E
FY17E
FY18E
FY17E
FY18E
FY17E
FY18E
FY17E
FY18E
FY17E
FY18E
FY17E
FY18E
Capital Goods
Voltas
Buy
334
407
11,060
6,511
7,514
7.9
8.7
12.9
16.3
25.9
20.5
4.7
4.1
16.7
18.5
1.5
1.2
BGR Energy
Neutral
132
-
953
16,567
33,848
6.0
5.6
7.8
5.9
16.9
22.4
1.0
0.9
4.7
4.2
0.2
0.1
BHEL
Neutral
140
-
34,193
28,797
34,742
-
2.8
2.3
6.9
60.7
20.3
1.0
1.0
1.3
4.8
0.8
0.6
Blue Star
Buy
530
634
5,067
4,283
5,077
5.9
7.3
14.9
22.1
35.6
24.0
6.9
5.8
20.4
26.4
1.2
1.0
Crompton Greaves
Neutral
66
-
4,149
5,777
6,120
5.9
7.0
3.3
4.5
20.1
14.7
0.9
0.8
4.4
5.9
0.7
0.6
Greaves Cotton
Neutral
139
-
3,404
1,755
1,881
16.8
16.9
7.8
8.5
17.9
16.4
3.6
3.3
20.6
20.9
1.6
1.5
Inox Wind
Neutral
183
-
4,070
5,605
6,267
15.7
16.4
24.8
30.0
7.4
6.1
2.1
1.5
25.9
24.4
0.8
0.6
KEC International
Neutral
154
-
3,962
9,294
10,186
7.9
8.1
9.9
11.9
15.6
13.0
2.3
2.0
15.6
16.3
0.7
0.6
KEI Industries
Accumulate
140
153
1,089
2,574
2,921
10.4
10.0
10.1
11.8
13.9
11.8
2.5
2.1
17.7
17.4
0.6
0.6
Thermax
Neutral
806
-
9,609
5,421
5,940
7.3
7.3
25.7
30.2
31.4
26.7
3.8
3.5
12.2
13.1
1.7
1.5
VATech Wabag
Buy
487
681
2,658
3,136
3,845
8.9
9.1
26.0
35.9
18.7
13.6
2.3
2.0
13.4
15.9
0.8
0.6
Cement
ACC
Neutral
1,465
-
27,502
11,225
13,172
13.2
16.9
44.5
75.5
32.9
19.4
3.1
2.9
11.2
14.2
2.5
2.1
Ambuja Cements
Neutral
235
-
46,613
9,350
10,979
18.2
22.5
5.8
9.5
40.5
24.7
3.4
3.1
10.2
12.5
5.0
4.3
India Cements
Neutral
159
-
4,890
4,364
4,997
18.5
19.2
7.9
11.3
20.2
14.1
1.5
1.4
8.0
8.5
1.9
1.6
JK Cement
Neutral
739
-
5,163
4,398
5,173
15.5
17.5
31.2
55.5
23.7
13.3
2.8
2.5
12.0
15.5
1.7
1.4
J K Lakshmi Cement
Buy
383
565
4,503
2,913
3,412
14.5
19.5
7.5
22.5
51.0
17.0
3.1
2.6
12.5
18.0
2.1
1.8
Orient Cement
Buy
139
215
2,853
2,114
2,558
18.5
20.5
8.1
11.3
17.2
12.3
2.5
2.1
9.0
14.0
2.0
1.5
UltraTech Cement
Neutral
3,783
-
103,839
25,768
30,385
21.0
23.5
111.0
160.0
34.1
23.7
4.4
3.8
13.5
15.8
4.1
3.4
Construction
ITNL
Neutral
111
-
3,663
8,946
10,017
31.0
31.6
8.1
9.1
13.8
12.2
0.5
0.5
4.2
5.0
3.7
3.5
KNR Constructions
Neutral
187
-
2,634
1,385
1,673
14.7
14.0
41.2
48.5
4.6
3.9
0.9
0.7
14.9
15.2
2.0
1.6
Larsen & Toubro
Accumulate
1,491
1,634
139,039
111,017
124,908
11.0
11.0
61.1
66.7
24.4
22.3
2.9
2.7
13.1
12.9
2.3
2.1
Gujarat Pipavav Port
Neutral
141
-
6,833
705
788
52.2
51.7
5.0
5.6
28.3
25.2
2.8
2.5
11.2
11.2
9.3
7.9
Nagarjuna Const.
Neutral
85
-
4,703
8,842
9,775
9.1
8.8
5.3
6.4
16.0
13.2
1.3
1.2
8.2
9.1
0.7
0.6
PNC Infratech
Buy
106
143
2,721
2,350
2,904
13.1
13.2
9.0
8.8
11.8
12.1
0.4
0.4
15.9
13.9
1.3
1.0
Simplex Infra
Neutral
317
-
1,567
6,829
7,954
10.5
10.5
31.4
37.4
10.1
8.5
1.1
1.0
9.9
13.4
0.7
0.6
Power Mech Projects
Neutral
451
-
663
1,801
2,219
12.7
14.6
72.1
113.9
6.3
4.0
1.2
1.0
16.8
11.9
0.4
0.3
Sadbhav Engineering
Accumulate
280
298
4,805
3,598
4,140
10.3
10.6
9.0
11.9
31.1
23.5
3.3
2.9
9.9
11.9
1.6
1.4
NBCC
Neutral
275
-
16,485
7,428
9,549
7.9
8.6
8.2
11.0
33.5
25.0
1.7
1.3
28.2
28.7
1.9
1.4
MEP Infra
Neutral
42
-
680
1,877
1,943
30.6
29.8
3.0
4.2
14.0
10.0
6.8
4.6
0.6
0.6
1.7
1.6
Stock Watch
February 02, 2017
Company Name
Reco
CMP
Target
Mkt Cap
Sales ( Čcr )
OPM(%)
EPS (Č)
PER(x)
P/BV(x)
RoE(%)
EV/Sales(x)
(Č)
Price ( Č)
( Č cr )
FY17E
FY18E
FY17E
FY18E
FY17E
FY18E
FY17E
FY18E
FY17E
FY18E
FY17E
FY18E
FY17E
FY18E
Construction
SIPL
Neutral
100
-
3,533
1,036
1,252
65.5
66.2
(8.4)
(5.6)
3.8
4.3
(22.8)
(15.9)
11.6
9.7
Engineers India
Neutral
153
-
10,283
1,725
1,935
16.0
19.1
11.4
13.9
13.4
11.0
1.9
1.8
13.4
15.3
4.9
4.4
Financials
Axis Bank
Buy
476
580
113,811
46,932
53,575
3.5
3.4
32.4
44.6
14.7
10.7
1.9
1.6
13.6
16.5
-
-
Bank of Baroda
Neutral
173
-
39,897
19,980
23,178
1.8
1.8
11.5
17.3
15.1
10.0
1.7
1.4
8.3
10.1
-
-
Canara Bank
Neutral
293
-
15,888
15,225
16,836
1.8
1.8
14.5
28.0
20.2
10.5
1.4
1.1
5.8
8.5
-
-
Can Fin Homes
Accumulate
1,900
2,128
5,058
420
526
3.5
3.5
86.5
107.8
22.0
17.6
4.7
3.9
23.6
24.1
-
-
Cholamandalam Inv. &
Buy
1,028
1,230
16,061
2,012
2,317
6.3
6.3
42.7
53.6
24.1
19.2
3.8
3.3
16.9
18.3
-
-
Fin. Co.
Dewan Housing Finance Buy
295
350
9,250
2,225
2,688
2.9
2.9
29.7
34.6
10.0
8.5
1.6
1.4
16.1
16.8
-
-
Equitas Holdings
Buy
171
235
5,718
939
1,281
11.7
11.5
5.8
8.2
29.4
20.8
2.5
2.3
10.9
11.5
-
-
Federal Bank
Accumulate
79
85
13,670
8,259
8,995
3.0
3.0
4.3
5.6
18.5
14.2
1.6
1.4
8.5
10.1
-
-
HDFC
Neutral
1,415
-
224,255
11,475
13,450
3.4
3.4
45.3
52.5
31.2
27.0
6.0
5.3
20.2
20.5
-
-
HDFC Bank
Accumulate
1,306
1,375
333,472
46,097
55,433
4.5
4.5
58.4
68.0
22.4
19.2
3.9
3.3
18.8
18.6
-
-
ICICI Bank
Accumulate
281
315
163,504
42,800
44,686
3.1
3.3
18.0
21.9
15.6
12.8
2.1
2.0
11.1
12.3
-
-
Lakshmi Vilas Bank
Buy
140
174
2,674
3,339
3,799
2.7
2.8
11.0
14.0
12.7
10.0
1.3
1.2
11.2
12.7
-
-
LIC Housing Finance
Accumulate
570
630
28,776
3,712
4,293
2.6
2.5
39.0
46.0
14.6
12.4
2.7
2.3
19.9
20.1
-
-
Punjab Natl.Bank
Neutral
140
-
29,866
23,532
23,595
2.3
2.4
6.8
12.6
20.6
11.1
3.2
2.3
3.3
6.5
-
-
RBL Bank
Neutral
401
-
14,827
1,783
2,309
2.6
2.6
12.7
16.4
31.6
24.5
3.4
3.1
12.8
13.3
-
-
South Ind.Bank
Neutral
21
-
2,886
6,435
7,578
2.5
2.5
2.7
3.1
7.9
6.9
1.0
0.9
10.1
11.2
-
-
St Bk of India
Neutral
270
-
215,524
88,650
98,335
2.6
2.6
13.5
18.8
20.0
14.4
1.9
1.7
7.0
8.5
-
-
Union Bank
Neutral
152
-
10,435
13,450
14,925
2.3
2.3
25.5
34.5
6.0
4.4
0.9
0.7
7.5
10.2
-
-
Yes Bank
Neutral
1,413
-
59,758
8,978
11,281
3.3
3.4
74.0
90.0
19.1
15.7
3.6
3.1
17.0
17.2
-
-
FMCG
Asian Paints
Neutral
990
-
94,994
17,128
18,978
16.8
16.4
19.1
20.7
51.9
47.8
18.0
17.0
34.8
35.5
5.5
4.9
Britannia
Accumulate
3,231
3,626
38,772
9,594
11,011
14.6
14.9
80.3
94.0
40.2
34.4
16.5
12.8
41.2
-
3.9
3.4
Colgate
Accumulate
893
995
24,284
4,605
5,149
23.4
23.4
23.8
26.9
37.5
33.2
20.8
16.2
64.8
66.8
5.2
4.6
Dabur India
Accumulate
276
304
48,653
8,315
9,405
19.8
20.7
8.1
9.2
34.1
30.0
9.5
7.9
31.6
31.0
5.5
4.8
GlaxoSmith Con*
Neutral
5,179
-
21,779
4,350
4,823
21.2
21.4
179.2
196.5
28.9
26.4
7.7
6.5
27.1
26.8
4.4
3.9
Godrej Consumer
Neutral
1,614
-
54,985
10,235
11,428
18.4
18.6
41.1
44.2
39.3
36.5
8.7
7.4
24.9
24.8
5.5
4.8
HUL
Neutral
854
-
184,797
35,252
38,495
17.8
17.8
20.7
22.4
41.4
38.1
39.5
33.9
95.6
88.9
5.1
4.6
ITC
Accumulate
270
284
326,913
40,059
44,439
38.3
39.2
9.0
10.1
30.0
26.6
8.4
7.3
27.8
27.5
7.7
6.9
Stock Watch
February 02, 2017
Company Name
Reco
CMP
Target
Mkt Cap
Sales ( Čcr )
OPM(%)
EPS (Č)
PER(x)
P/BV(x)
RoE(%)
EV/Sales(x)
(Č)
Price ( Č)
( Č cr )
FY17E FY18E
FY17E
FY18E
FY17E
FY18E
FY17E
FY18E
FY17E
FY18E
FY17E
FY18E
FY17E
FY18E
FMCG
Marico
Buy
258
300
33,337
6,430
7,349
18.8
19.5
6.4
7.7
40.4
33.6
12.2
10.3
33.2
32.5
5.0
4.3
Nestle*
Neutral
5,909
-
56,973
10,073
11,807
20.7
21.5
124.8
154.2
47.4
38.3
19.4
17.5
34.8
36.7
5.5
4.6
Tata Global
Neutral
130
-
8,211
8,675
9,088
9.8
9.8
7.4
8.2
17.6
15.9
2.0
1.9
7.9
8.1
0.9
0.8
Procter & Gamble
Accumulate
7,000
7,369
22,723
2,939
3,342
23.2
23.0
146.2
163.7
47.9
42.8
107.2
102.8
25.3
23.5
7.3
6.3
Hygiene
IT
HCL Tech^
Buy
814
1,000
114,907
49,242
57,168
20.5
20.5
55.7
64.1
14.6
12.7
3.0
2.3
20.3
17.9
2.2
1.8
Infosys
Buy
917
1,249
210,526
68,350
77,326
27.0
27.0
62.5
69.4
14.7
13.2
3.1
2.9
21.3
21.6
2.5
2.2
TCS
Buy
2,169
2,620
427,475
119,025
133,308
27.6
27.6
131.2
145.5
16.5
14.9
5.4
4.9
32.4
33.1
3.4
3.0
Tech Mahindra
Buy
449
600
43,669
29,673
32,937
15.5
17.0
32.8
39.9
13.7
11.3
2.7
2.3
19.6
20.7
1.2
1.0
Wipro
Buy
455
583
110,665
55,440
60,430
18.1
18.1
35.9
39.9
12.7
11.4
2.3
2.1
19.0
19.3
1.7
1.6
Media
D B Corp
Neutral
375
-
6,891
2,297
2,590
27.4
28.2
21.0
23.4
17.9
16.0
4.2
3.6
23.7
23.1
2.8
2.4
HT Media
Neutral
81
-
1,875
2,693
2,991
12.6
12.9
7.9
9.0
10.2
9.0
0.9
0.8
7.8
8.3
0.3
0.2
Jagran Prakashan
Buy
185
225
6,058
2,355
2,635
28.0
28.0
10.8
12.5
17.2
14.8
3.7
3.2
21.7
21.7
2.6
2.3
Sun TV Network
Neutral
551
-
21,696
2,850
3,265
70.1
71.0
26.2
30.4
21.0
18.1
5.4
4.8
24.3
25.6
7.2
6.2
Hindustan Media
Neutral
271
-
1,987
1,016
1,138
24.3
25.2
27.3
30.1
9.9
9.0
1.9
1.7
16.2
15.8
1.3
1.1
Ventures
TV Today Network
Buy
270
385
1,609
637
743
27.5
27.5
18.4
21.4
14.7
12.6
2.6
2.2
17.4
17.2
2.1
1.7
Metals & Mining
Coal India
Neutral
313
-
194,323
84,638
94,297
21.4
22.3
24.5
27.1
12.8
11.6
5.3
5.1
42.6
46.0
1.8
1.6
Hind. Zinc
Neutral
306
-
129,147
14,252
18,465
55.9
48.3
15.8
21.5
19.3
14.2
3.2
2.8
17.0
20.7
9.1
7.0
Hindalco
Neutral
199
-
41,106
107,899
112,095
7.4
8.2
9.2
13.0
21.6
15.3
1.0
1.0
4.8
6.6
0.9
0.8
JSW Steel
Neutral
197
-
47,680
53,201
58,779
16.1
16.2
130.6
153.7
1.5
1.3
0.2
0.2
14.0
14.4
1.7
1.4
NMDC
Neutral
149
-
47,110
6,643
7,284
44.4
47.7
7.1
7.7
21.0
19.3
1.8
1.8
8.8
9.2
4.9
4.4
SAIL
Neutral
66
-
27,135
47,528
53,738
(0.7)
2.1
(1.9)
2.6
25.3
0.7
0.7
(1.6)
3.9
1.4
1.3
Vedanta
Neutral
261
-
77,245
71,744
81,944
19.2
21.7
13.4
20.1
19.4
13.0
1.7
1.5
8.4
11.3
1.5
1.1
Tata Steel
Neutral
473
-
45,972
121,374
121,856
7.2
8.4
18.6
34.3
25.5
13.8
1.6
1.5
6.1
10.1
1.0
1.0
Oil & Gas
Cairn India
Neutral
283
-
53,171
9,127
10,632
4.3
20.6
8.8
11.7
32.2
24.2
1.0
1.0
3.3
4.2
7.3
6.1
GAIL
Neutral
485
-
61,489
56,220
65,198
9.3
10.1
27.1
33.3
17.9
14.6
1.6
1.5
9.3
10.7
1.3
1.1
ONGC
Neutral
200
-
256,986
137,222
152,563
15.0
21.8
19.5
24.1
10.3
8.3
0.9
0.8
8.5
10.1
2.2
1.9
Indian Oil Corp
Neutral
375
-
182,315
373,359
428,656
5.9
5.5
54.0
59.3
7.0
6.3
1.1
1.0
16.0
15.6
0.6
0.6
Reliance Industries
Neutral
1,049
-
340,318
301,963
358,039
12.1
12.6
87.7
101.7
12.0
10.3
1.2
1.1
10.7
11.3
1.6
1.3
Pharmaceuticals
Alembic Pharma
Neutral
555
-
10,465
3,483
4,083
20.2
21.4
24.3
30.4
22.8
18.3
5.2
4.2
25.5
25.3
2.9
2.4
Stock Watch
February 02, 2017
Company Name
Reco
CMP
Target
Mkt Cap
Sales ( Čcr )
OPM(%)
EPS (Č)
PER(x)
P/BV(x)
RoE(%)
EV/Sales(x)
(Č)
Price ( Č)
( Č cr )
FY17E FY18E
FY17E
FY18E
FY17E
FY18E
FY17E
FY18E
FY17E
FY18E
FY17E
FY18E
FY17E
FY18E
Pharmaceuticals
Alkem Laboratories Ltd
Buy
1,695
1,989
20,263
6,043
6,893
18.7
19.3
80.5
88.8
21.1
19.1
4.7
3.9
22.3
20.3
3.3
2.8
Aurobindo Pharma
Buy
667
877
39,010
15,720
18,078
23.7
23.7
41.4
47.3
16.1
14.1
4.2
3.3
29.6
26.1
2.7
2.3
Sanofi India*
Neutral
4,072
-
9,378
2,277
2,597
17.3
18.3
149.4
172.0
27.3
23.7
4.5
3.6
25.1
28.8
3.8
3.1
Cadila Healthcare
Accumulate
353
400
36,097
10,429
12,318
22.6
22.0
16.9
19.2
20.9
18.4
5.3
4.3
28.5
25.7
3.5
2.8
Cipla
Reduce
573
490
46,113
15,378
18,089
17.4
18.4
21.6
27.2
26.5
21.1
3.4
3.0
13.7
15.2
3.2
2.7
Dr Reddy's
Neutral
2,997
-
49,646
16,043
18,119
20.8
22.4
112.4
142.9
26.7
21.0
3.6
3.1
14.1
15.9
3.1
2.7
Dishman Pharma
Neutral
228
-
3,679
1,718
1,890
22.7
22.8
9.5
11.3
24.0
20.2
2.3
2.1
10.1
10.9
2.6
2.3
GSK Pharma*
Neutral
2,723
-
23,061
3,000
3,312
15.4
20.6
46.5
60.8
58.6
44.8
14.1
14.0
26.3
30.6
7.4
6.8
Indoco Remedies
Reduce
267
240
2,461
1,112
1,289
16.2
18.2
11.6
16.0
23.0
16.7
3.7
3.1
17.0
20.1
2.3
2.0
Ipca labs
Buy
531
613
6,698
3,303
3,799
15.3
15.3
17.3
19.7
30.7
27.0
2.7
2.4
9.1
9.4
2.2
1.9
Lupin
Buy
1,472
1,809
66,454
15,912
18,644
26.4
26.7
58.1
69.3
25.3
21.2
4.9
4.0
21.4
20.9
4.3
3.5
Sun Pharma
Buy
625
847
149,915
31,129
35,258
32.0
32.9
30.2
35.3
20.7
17.7
3.4
2.8
20.0
20.1
4.4
3.7
Power
Tata Power
Neutral
81
-
21,773
36,916
39,557
17.4
27.1
5.1
6.3
15.8
12.8
1.4
1.3
9.0
10.3
1.6
1.4
NTPC
Neutral
171
-
140,626
86,605
95,545
17.5
20.8
11.8
13.4
14.5
12.7
1.5
1.4
10.5
11.1
3.0
3.0
Power Grid
Accumulate
206
223
107,666
25,315
29,193
88.2
88.7
14.2
17.2
14.5
12.0
2.2
1.9
15.2
16.1
8.9
8.0
Real Estate
MLIFE
Buy
356
522
1,461
1,152
1,300
22.7
24.6
29.9
35.8
11.9
9.9
0.9
0.8
7.6
8.6
2.0
1.7
Telecom
Bharti Airtel
Neutral
345
-
137,930
105,086
114,808
34.5
34.7
12.2
16.4
28.3
21.0
1.9
1.8
6.8
8.4
2.2
1.9
Idea Cellular
Neutral
107
-
38,696
40,133
43,731
37.2
37.1
6.4
6.5
16.8
16.5
1.4
1.3
8.2
7.6
2.0
1.7
zOthers
Abbott India
Neutral
4,399
-
9,347
3,153
3,583
14.1
14.4
152.2
182.7
28.9
24.1
141.9
121.2
25.6
26.1
2.7
2.3
Bajaj Electricals
Accumulate
243
274
2,457
4,801
5,351
5.7
6.2
10.4
13.7
23.3
17.7
2.9
2.6
12.4
14.5
0.5
0.5
Finolex Cables
Neutral
444
-
6,793
2,883
3,115
12.0
12.1
14.2
18.6
31.3
23.9
16.6
14.5
15.8
14.6
2.1
1.8
Goodyear India*
Neutral
716
-
1,650
1,598
1,704
10.4
10.2
49.4
52.6
14.5
13.6
66.9
58.7
18.2
17.0
0.7
99.7
Hitachi
Neutral
1,430
-
3,888
2,081
2,433
8.8
8.9
33.4
39.9
42.8
35.8
34.5
28.8
22.1
21.4
1.9
1.6
Jyothy Laboratories
Neutral
352
-
6,386
1,440
2,052
11.5
13.0
8.5
10.0
41.4
35.2
10.0
9.3
18.6
19.3
4.7
3.3
Page Industries
Neutral
14,381
-
16,041
2,450
3,124
20.1
17.6
299.0
310.0
48.1
46.4
320.3
244.5
47.1
87.5
6.6
5.2
Relaxo Footwears
Neutral
435
-
5,221
2,085
2,469
9.2
8.2
7.6
8.0
57.5
54.7
22.3
19.0
17.9
18.8
2.6
2.2
Siyaram Silk Mills
Accumulate
1,430
1,605
1,340
1,733
1,948
11.6
11.7
96.6
114.7
14.8
12.5
2.3
2.0
15.3
15.7
1.0
0.9
Styrolution ABS India*
Neutral
608
-
1,069
1,440
1,537
9.2
9.0
40.6
42.6
15.0
14.3
38.2
34.8
12.3
11.6
0.7
0.6
TVS Srichakra
Neutral
3,298
-
2,526
2,304
2,614
13.7
13.8
231.1
266.6
14.3
12.4
370.6
291.8
33.9
29.3
1.1
0.9
Stock Watch
February 02, 2017
Company Name
Reco
CMP
Target
Mkt Cap
Sales ( Čcr )
OPM(%)
EPS (Č)
PER(x)
P/BV(x)
RoE(%)
EV/Sales(x)
(Č)
Price ( Č)
( Č cr )
FY17E
FY18E
FY17E
FY18E
FY17E
FY18E
FY17E
FY18E
FY17E
FY18E
FY17E
FY18E
FY17E
FY18E
zOthers
HSIL
Neutral
293
-
2,118
2,384
2,515
15.8
16.3
15.3
19.4
19.1
15.1
19.0
16.4
7.8
9.3
1.1
1.0
Kirloskar Engines India
Neutral
339
-
4,902
2,554
2,800
9.9
10.0
10.5
12.1
32.3
28.0
13.5
12.7
10.7
11.7
1.6
1.4
Ltd
M M Forgings
Neutral
492
-
594
546
608
20.4
20.7
41.3
48.7
11.9
10.1
67.4
59.6
16.6
17.0
0.9
0.8
Banco Products (India) Neutral
209
-
1,495
1,353
1,471
12.3
12.4
14.5
16.3
14.4
12.8
19.9
17.9
14.5
14.6
1.0
112.1
Competent Automobiles Neutral
170
-
104
1,137
1,256
3.1
2.7
28.0
23.6
6.1
7.2
32.6
29.5
14.3
11.5
0.1
0.1
Nilkamal
Neutral
1,684
-
2,513
1,995
2,165
10.7
10.4
69.8
80.6
24.1
20.9
96.2
83.6
16.6
16.5
1.3
1.1
Visaka Industries
Neutral
207
-
328
1,051
1,138
10.3
10.4
21.0
23.1
9.8
8.9
26.5
24.8
9.0
9.2
0.6
0.5
Transport Corporation of
Neutral
164
-
1,255
2,671
2,911
8.5
8.8
13.9
15.7
11.8
10.5
1.6
1.4
13.7
13.8
0.6
0.5
India
Elecon Engineering
Neutral
57
-
641
1,482
1,660
13.7
14.5
3.9
5.8
14.6
9.8
3.4
3.2
7.8
10.9
0.8
0.7
Surya Roshni
Neutral
188
-
823
3,342
3,625
7.8
7.5
17.3
19.8
10.9
9.5
20.6
16.6
10.5
10.8
0.5
0.5
MT Educare
Neutral
129
-
513
366
417
17.7
18.2
9.4
10.8
13.8
11.9
3.1
2.7
22.2
22.3
1.3
1.1
Radico Khaitan
Buy
119
147
1,581
1,667
1,824
13.0
13.2
6.7
8.2
17.9
14.5
1.6
1.5
9.0
10.2
1.3
1.2
Garware Wall Ropes
Neutral
588
-
1,287
873
938
14.3
14.3
35.2
37.5
16.7
15.7
2.9
2.5
17.5
15.9
1.4
1.3
Wonderla Holidays
Neutral
361
-
2,039
287
355
38.0
40.0
11.3
14.2
31.9
25.4
4.6
4.0
21.4
23.9
6.8
5.5
Linc Pen & Plastics
Neutral
276
-
407
382
420
9.3
9.5
13.5
15.7
20.5
17.5
3.5
3.0
17.1
17.3
1.1
1.0
The Byke Hospitality
Neutral
162
-
650
287
384
20.5
20.5
7.6
10.7
21.3
15.1
4.5
3.6
20.7
23.5
2.3
1.7
Interglobe Aviation
Neutral
837
-
30,239
21,122
26,005
14.5
27.6
110.7
132.1
7.6
6.3
45.2
32.3
168.5
201.1
1.4
1.1
Coffee Day Enterprises
Neutral
199
-
4,107
2,964
3,260
20.5
21.2
4.7
8.0
-
24.9
2.3
2.1
5.5
8.5
1.8
1.6
Ltd
Navneet Education
Neutral
127
-
3,017
1,062
1,147
24.0
24.0
6.1
6.6
20.8
19.1
4.3
3.8
20.6
19.8
2.9
2.7
Navkar Corporation
Buy
171
265
2,433
369
561
42.9
42.3
7.2
11.5
23.6
14.8
1.7
1.6
7.4
10.5
7.6
5.0
UFO Moviez
Neutral
457
-
1,262
619
685
33.2
33.4
30.0
34.9
15.3
13.1
2.1
1.8
13.8
13.9
1.7
1.4
VRL Logistics
Neutral
297
-
2,710
1,902
2,119
16.7
16.6
14.6
16.8
20.4
17.7
4.5
3.9
21.9
22.2
1.5
1.4
Team Lease Serv.
Neutral
889
-
1,520
3,229
4,001
1.5
1.8
22.8
32.8
39.0
27.1
4.2
3.6
10.7
13.4
0.4
0.3
S H Kelkar & Co.
Neutral
319
-
4,611
1,036
1,160
15.1
15.0
6.1
7.2
52.2
44.4
5.6
5.1
10.7
11.5
4.3
3.8
Quick Heal
Neutral
271
-
1,896
408
495
27.3
27.0
7.7
8.8
34.9
30.8
3.2
3.3
9.3
10.6
3.8
3.1
Narayana Hrudaya
Neutral
335
-
6,842
1,873
2,166
11.5
11.7
2.6
4.0
126.6
84.5
7.8
7.0
6.1
8.3
3.8
3.2
Manpasand Bever.
Neutral
645
-
3,688
836
1,087
19.6
19.4
16.9
23.8
38.2
27.1
4.6
4.0
12.0
14.8
4.2
3.1
Parag Milk Foods
Neutral
265
-
2,232
1,919
2,231
9.3
9.6
9.5
12.9
28.1
20.5
4.4
3.6
15.5
17.5
1.3
1.1
Mirza International
Buy
91
107
1,100
987
1,106
18.0
18.0
6.5
7.6
14.0
12.0
2.3
1.9
15.9
15.7
1.3
1.2
Stock Watch
February 02, 2017
Company Name
Reco
CMP
Target Mkt Cap
Sales ( Čcr )
OPM(%)
EPS (Č)
PER(x)
P/BV(x)
RoE(%)
EV/Sales(x)
(Č)
Price ( Č)
( Č cr )
FY17E FY18E FY17E FY18E FY17E FY18E FY17E FY18E FY17E FY18E FY17E FY18E FY17E FY18E
zOthers
Asian Granito
Buy
273
351
820
1,071
1,182
12.1
12.4
12.7
16.0
21.4
17.1
2.0
1.8
9.5
10.7
1.1
0.9
Source: Company, Angel Research; Note: *December year end; #September year end; &October year end; Price as on February 01, 2017
Market Outlook
February 02, 2017
Research Team Tel: 022 - 39357800
DISCLAIMER
Angel Broking Private Limited (hereinafter referred to as “Angel”) is a registered Member of National Stock Exchange of India
Limited,Bombay Stock Exchange Limited and Metropolitan Stock Exchange Limited. It is also registered as a Depository Participant with
CDSL and Portfolio Manager with SEBI. It also has registration with AMFI as a Mutual Fund Distributor. Angel Broking Private Limited is a
registered entity with SEBI for Research Analyst in terms of SEBI (Research Analyst) Regulations, 2014 vide registration number
INH000000164. Angel or its associates has not been debarred/ suspended by SEBI or any other regulatory authority for accessing
/dealing in securities Market. Angel or its associates/analyst has not received any compensation / managed or
co-managed public offering of securities of the company covered by Analyst during the past twelve months.
This document is solely for the personal information of the recipient, and must not be singularly used as the basis of any investment
decision. Nothing in this document should be construed as investment or financial advice. Each recipient of this document should make
such investigations as they deem necessary to arrive at an independent evaluation of an investment in the securities of the companies
referred to in this document (including the merits and risks involved), and should consult their own advisors to determine the merits and
risks of such an investment.
Reports based on technical and derivative analysis center on studying charts of a stock's price movement, outstanding positions and
trading volume, as opposed to focusing on a company's fundamentals and, as such, may not match with a report on a company's
fundamentals. Investors are advised to refer the Fundamental and Technical Research Reports available on our website to evaluate the
contrary view, if any.
The information in this document has been printed on the basis of publicly available information, internal data and other reliable
sources believed to be true, but we do not represent that it is accurate or complete and it should not be relied on as such, as this
document is for general guidance only. Angel Broking Pvt. Limited or any of its affiliates/ group companies shall not be in any way
responsible for any loss or damage that may arise to any person from any inadvertent error in the information contained in this report.
Angel Broking Pvt. Limited has not independently verified all the information contained within this document. Accordingly, we cannot
testify, nor make any representation or warranty, express or implied, to the accuracy, contents or data contained within this document.
While Angel Broking Pvt. Limited endeavors to update on a reasonable basis the information discussed in this material, there may be
regulatory, compliance, or other reasons that prevent us from doing so.
This document is being supplied to you solely for your information, and its contents, information or data may not be reproduced,
redistributed or passed on, directly or indirectly.
Neither Angel Broking Pvt. Limited, nor its directors, employees or affiliates shall be liable for any loss or damage that may arise from
or in connection with the use of this information.